
Space Weather Observations, Alerts, and Forecast ( Includes Aurora Alerts )
Australian - Daily Report ( can be viewed here ) : SWS DAILY SOLAR AND GEOPHYSICAL REPORT
3-day Solar-Geophysical Forecast
Product: 3-Day Forecast
- Issued: 2024 Apr 27 0030 UTC
Prepared by the U.S. Dept. of Commerce, NOAA, Space Weather Prediction Center.
Geomagnetic Activity Observation and Forecast
The greatest observed 3 hr Kp over the past 24 hours was 5 (NOAA Scale G1). The greatest expected 3 hr Kp for Apr 27-Apr 29 2024 is 4.00 (below NOAA Scale levels).
| Apr 27 | Apr 28 | Apr 29 | |
|---|---|---|---|
| 00-03UT | 3.67 | 3.67 | 2.67 |
| 03-06UT | 3.00 | 3.33 | 2.00 |
| 06-09UT | 3.00 | 3.33 | 2.33 |
| 09-12UT | 4.00 | 3.00 | 2.67 |
| 12-15UT | 3.00 | 3.00 | 2.33 |
| 15-18UT | 3.00 | 3.33 | 2.33 |
| 18-21UT | 3.00 | 2.00 | 2.33 |
| 21-00UT | 3.67 | 2.00 | 2.33 |
Rationale: No G1 (Minor) or greater geomagnetic storms are expected.
Solar Radiation Activity Observation and Forecast
Solar radiation, as observed by NOAA GOES-18 over the past 24 hours, was below S-scale storm level thresholds.
| Apr 27 | Apr 28 | Apr 29 | |
|---|---|---|---|
| S1 or greater | 15% | 5% | 1% |
Rationale: There is a slight chance for S1 (Minor) storms on 27 Apr due to the location and flare potential of multiple active regions.
Radio Blackout Activity and Forecast
No radio blackouts were observed over the past 24 hours.
| Apr 27 | Apr 28 | Apr 29 | |
|---|---|---|---|
| R1-R2 | 75% | 55% | 35% |
| R3 or greater | 15% | 5% | 5% |
Rationale: R1-R2 (Minor-Moderate) radio blackouts are expected, with a slight chance for an R3 (Strong) event, on 27 Apr. R1-R2 events are likely on 28 Apr and there is a chance for R1-R2 events on 29 Apr.

Real Time Images of the Sun
SOHO EIT 171
|
SOHO EIT 195
|
SOHO EIT 284
|
SOHO EIT 304
|
SDO/HMI Continuum
|
SDO/HMI Magnetogram
|
LASCO C2
|
LASCO C3
|
| The sun is constantly monitored for sun spots and coronal mass ejections. EIT (Extreme ultraviolet Imaging Telescope) images the solar atmosphere at several wavelengths, and therefore, shows solar material at different temperatures. In the images taken at 304 Angstrom the bright material is at 60,000 to 80,000 degrees Kelvin. In those taken at 171 Angstrom, at 1 million degrees. 195 Angstrom images correspond to about 1.5 million Kelvin, 284 Angstrom to 2 million degrees. The hotter the temperature, the higher you look in the solar atmosphere. |
Real Time Solar X-ray and Solar Wind
Current Solar Wind Speed
Data supplied by SWS Space Weather Services (BoM). |
Solar X-ray Flux
|
Satellite Environment Plot
|
|
WSA-Enlil Solar Wind Prediction |
| Move your cursor over the timeline to 'scrub' through the forecast. |
| WSA-Enlil is a large-scale, physics-based prediction model of the heliosphere, used by the Space Weather Forecast Office to provide 1-4 day advance warning of solar wind structures and Earth-directed coronal mass ejections (CMEs) that cause geomagnetic storms. Solar disturbances have long been known to disrupt communications, wreak havoc with geomagnetic systems, and to pose dangers for satellite operations. |
Solar Cycle
| The Solar Cycle is observed by counting the frequency and placement of sunspots visible on the Sun. The forecast comes from the Solar Cycle Prediction Panel representing NOAA, NASA and the International Space Environmental Services (ISES). The Prediction Panel has predicted Cycle 25 to reach a maximum of 115 occurring in July, 2025. The solar radio flux at 10.7 cm (2800 MHz) is an excellent indicator of solar activity. Often called the F10.7 index, it is one of the longest running records of solar activity. The F10.7 radio emissions originates high in the chromosphere and low in the corona of the solar atmosphere. The F10.7 correlates well with the sunspot number as well as a number of UltraViolet (UV) and visible solar irradiance records. |
Solar Cycle - SunSpots

| Current solar cycle: observed monthly sunspot number (thin yellow), observed smoothed monthly sunspot number (thick turquoise) and predicted smoothed monthly sunspot number (magenta crosses). |
Auroral Activity Forecast
NORTHERN HEMISPHERE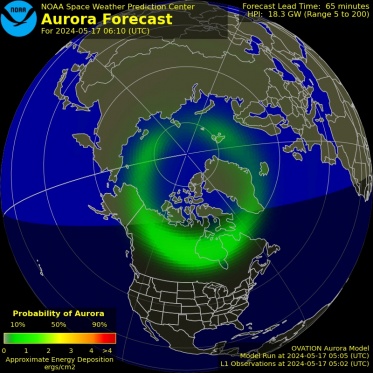
|
SOUTHERN HEMISPHERE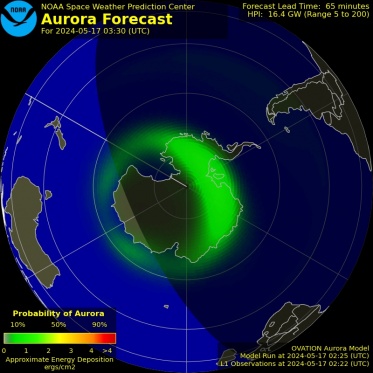
|
| Map courtesy of NOAA - OVATION Aurora - Prime Model Instruments on board the NOAA Polar-orbiting Operational Environmental Satellite (POES) continually monitor the power flux carried by the protons and electrons that produce aurora in the atmosphere. SWPC has developed a technique that uses the power flux observations obtained during a single pass of the satellite over a polar region (which takes about 25 minutes) to estimate the total power deposited in an entire polar region by these auroral particles. The power input estimate is converted to an auroral activity index that ranges from 1 to 10. You may also like to view the : Auroral Oval Prediction Tool by the : SWS (Space Weather Services) Australian Bureau of Meteorology |
Radio Communications Impact
D-Region Absorption
D-Region Absorption Prediction
|
| The D-Region Absorption Product addresses the operational impact of the solar X-ray flux and SEP events on HF radio communication. Long-range communications using high frequency (HF) radio waves (3 - 30 MHz) depend on reflection of the signals in the ionosphere. Radio waves are typically reflected near the peak of the F2 layer (~300 km altitude), but along the path to the F2 peak and back the radio wave signal suffers attenuation due to absorption by the intervening ionosphere. The D-Region Absorption Prediction model is used as guidance to understand the HF radio degradation and blackouts this can cause. |
Australian Aurora Alert - Detail - Aurora Alert
| Aurora Alerts are issued whenever the Australian region estimated K-index reaches 6 or greater. When an alert is current the alert information indicates the latitudinal range in terms of high, middle, low and equatorial regions where aurora may be visible under good observing conditions. |
Australian Aurora Watch - Detail - Aurora Watch
| Aurora Watches are warnings with lead times of up to 48 hours. They will only be issued in response to a significant solar Coronal Mass Ejection (CME) or coronal hole likely to be geo-effective. Aurora alerts will follow if favourable space weather activity acutally occurs. |
Australian Aurora Outlook - Detail - Aurora Outlook
| Aurora Outlooks are warnings with lead times of 3-7 days. They will be issued in response to the presence of a large active solar region expected to rotate into a position that is favourable for CMEs, and similarly for significant coronal holes. Solar regions that maintain high levels of solar flare activity for sustained periods are rare. Consequently, these notices are likely to be infrequent. Aurora watches and/or alerts will follow if a geoeffective CME is observed and/or significant geomagnetic activity actually occurs. |
Australian Geomagnetic Warning - Detail - Geomagnetic Warning
| Geomagnetic Warnings are issued whenever expected increased levels of geomagnetic activity are current. |
Australian Geomagnetic Alert - Detail - Geomagnetic Alert
| Geomagnetic Alerts are issued whenever the Australian region estimated K-index reaches 5 or greater. |
Australian Region K-index - Detail - Current Estimated Aus K-index
| K index is a measure of geomagnetic activity for a 3-hour period. The larger the K index, the greater the chance of seeing an aurora at lower latitudes. To check if an aurora could be visible at your latitude for a given K-index value, look at the table of visibility range estimates or try out the Auroral Oval Prediction Tool. The Kaus index is the Estimated Australian Region K index sourced from SWS. Kaus is a near real-time estimate of the K index for the Australian region, which is recalculated approximately every 5 minutes. The Kp index is the Estimated Planetary K index sourced from NOAA/SWPC. The Kp index is updated every 3-hours and its timestamp will be behind that of the Kaus index. Estimated K-indices generated for the Australian region are the average of the estimated K-indices from the individual stations and have a range of values from 0 (very quiet) up to 9 (extremely disturbed). |
Australian Region - Estimated K-Index Plot ( Updates Daily )

Hobart - Estimated K-Index Plot

Additional - Australian Geophysical Conditions - Links
Alert |
ISS - Space Station - Tracker
This tracker shows where the Space Station is right now. The shaddow overlay indicates where it is nighttime in the world.
Credits:
Space Weather Images and Information (excluded from copyright) courtesy of:
SWS (Space Weather Services) Australian Bureau of Meteorology
Aurora Api Info : Designed in ( Early Dec 2021 ) by : Beaumaris Weather and ( beteljuice, God Rest his Soul )
NOAA / NWS Space Weather Prediction Center
Mauna Loa Solar Observatory (HAO/NCAR)
SOHO (ESA & NASA).
Space Weather links:
SpaceWeather.com
Space Weather Services (Geophysical Information) Australian Bureau of Meteorology
Space Weather Services (Auroral Oval Prediction Tool) Australian Bureau of Meteorology
3-Day Forecast of Solar and Geophysical Activity
Space Weather Overview
LASCO Coronagraph
Real-Time Solar Wind
Space Weather Advisory Outlooks
Space Weather Forecast Disussions
Space Weather Alerts, Watches and Warnings
Solar and Heliospheric Observatory (SOHO)
The Very Latest SOHO Images
Powered by Space Weather PHP script by Mike Challis
Additions by:
Martin of Hebrides Weather
Grant Miles of CamWX
Ken True of Saratoga Weather
with 3-day Solar-Geophysical Forecast text formatting by Jeremy Dyde of Jerbils Weather